3.3. Tracking Methods: CPOL
This tutorial/demo illustrates how THUNER can be applied to CPOL, a C-band dual-polarisation research radar located at Gunn Point near Darwin, in Australia’s northern Territory.
3.3.1. Setup
 1%load_ext autoreload
 2%autoreload 2
 3
 4%matplotlib inline
 5
 6import shutil
 7import glob
 8import thuner.data as data
 9import thuner.option as option
10import thuner.track.track as track
11import thuner.visualize as visualize
12import thuner.analyze as analyze
13import thuner.default as default
14import thuner.attribute as attribute
15import thuner.parallel as parallel
16import thuner.utils as utils
17import thuner.config as config
Welcome to the Thunderstorm Event Reconnaissance (THUNER) package
v0.0.16! This package is still in testing and development. Please visit
github.com/THUNER-project/THUNER for examples, and to report issues or contribute.

THUNER is a flexible toolkit for performing multi-feature detection,
tracking, tagging and analysis of events within meteorological datasets.
The intended application is to convective weather events. For examples
and instructions, see https://github.com/THUNER-project/THUNER and
https://thuner.readthedocs.io/en/latest/. If you use THUNER in your research, consider
citing the following papers;

Short et al. (2023), doi: 10.1175/MWR-D-22-0146.1
Raut et al. (2021), doi: 10.1175/JAMC-D-20-0119.1
Fridlind et al. (2019), doi: 10.5194/amt-12-2979-2019
...
 1# Set a flag for whether or not to remove existing output directories
 2remove_existing_outputs = False
 3
 4# Specify the local base directory for saving outputs
 5base_local = config.get_outputs_directory()
 6
 7output_parent = base_local / "runs/cpol/geographic"
 8options_directory = output_parent / "options"
 9visualize_directory = output_parent / "visualize"
10
11# Remove the output parent directory if it already exists
12if output_parent.exists() and remove_existing_outputs:
13    shutil.rmtree(output_parent)
Run the cell below to get the demo data for this tutorial, if you haven’t already.
1# Download the demo data
2remote_directory = "s3://thuner-storage/THUNER_output/input_data/raw/cpol"
3data.get_demo_data(base_local, remote_directory)
4remote_directory = "s3://thuner-storage/THUNER_output/input_data/raw/"
5remote_directory += "era5_monthly_10S_129E_14S_133E"
6data.get_demo_data(base_local, remote_directory)
2025-07-09 16:46:30,104 - thuner.data._utils - INFO - Syncing directory /home/ewan/THUNER_output/input_data/raw/cpol. Please wait.
2025-07-09 16:46:31,670 - thuner.data._utils - INFO - Syncing directory /home/ewan/THUNER_output/input_data/raw/era5_monthly_10S_129E_14S_133E. Please wait.
3.3.2. Geographic Coordinates
CPOL level 1b data is provided in cartesian coordinates. We can convert this data to geographic coordinates on the fly by specifying default grid options. We will also save this converted data to disk for use later.
 1# Create the dataset options
 2start = "2005-11-13T14:00:00"
 3# Note the CPOL times are usually a few seconds off the 10 m interval, so add 30 seconds
 4# to ensure we capture 19:00:00
 5end = "2005-11-13T19:00:30"
 6times_dict = {"start": start, "end": end}
 7cpol_options = data.aura.CPOLOptions(**times_dict, converted_options={"save": True})
 8# cpol_options = data.aura.CPOLOptions(**times_dict, converted_options={"load": True})
 9era5_dict = {"latitude_range": [-14, -10], "longitude_range": [129, 133]}
10era5_pl_options = data.era5.ERA5Options(**times_dict, **era5_dict)
11era5_dict.update({"data_format": "single-levels"})
12era5_sl_options = data.era5.ERA5Options(**times_dict, **era5_dict)
13datasets=[cpol_options, era5_pl_options, era5_sl_options]
14data_options = option.data.DataOptions(datasets=datasets)
15data_options.to_yaml(options_directory / "data.yml")
16
17# Create the grid_options
18grid_options = option.grid.GridOptions()
19grid_options.to_yaml(options_directory / "grid.yml")
20
21# Create the track_options
22track_options = default.track(dataset_name="cpol")
23# Modify the default track options to demonstrate the tracking of both convective
24# objects, and mesoscale convective systems, which are built out of convective, middle
25# and stratiform echo objects, within the same THUNER run. We will use a larger
26# minimum size for the convective objects, as too many very small objects confuses the
27# matching algorithm.
28core = attribute.core.default_tracked()
29attributes = option.attribute.Attributes(name="convective", attribute_types=[core])
30track_options.levels[0].object_by_name("convective").attributes = attributes
31tint_tracking = option.track.TintOptions(search_margin=5)
32track_options.levels[0].object_by_name("convective").tracking = tint_tracking
33mask_options = option.track.MaskOptions(save=True)
34track_options.levels[0].object_by_name("convective").mask_options = mask_options
35track_options.levels[0].object_by_name("convective").detection.min_area = 64
36track_options.levels[0].object_by_name("convective").detection.altitudes
37track_options.levels[0].object_by_name("convective").revalidate()
38track_options.levels[0].revalidate()
39# We will also modify the mcs tracking options to save a record of the member object ids
40mcs_attributes = track_options.levels[1].object_by_name("mcs").attributes
41mcs_group_attr = mcs_attributes.attribute_type_by_name("group")
42membership = attribute.group.membership_attribute_group()
43mcs_group_attr.attributes.append(membership)
44mcs_group_attr.revalidate()
45track_options.to_yaml(options_directory / "track.yml")
2025-07-09 16:46:32,784 - thuner.data.aura - INFO - Generating cpol filepaths.
2025-07-09 16:46:32,786 - thuner.data.era5 - INFO - Generating era5 filepaths.
2025-07-09 16:46:32,789 - thuner.data.era5 - INFO - Generating era5 filepaths.
2025-07-09 16:46:32,808 - thuner.option.grid - WARNING - altitude not specified. Using default altitudes.
2025-07-09 16:46:32,810 - thuner.option.grid - WARNING - shape not specified. Will attempt to infer from input.
For this tutorial, we will generate figures during runtime to visualize how THUNER is matching both convective and mcs objects.
1# Create the visualize_options
2kwargs = {"visualize_directory": visualize_directory, "objects": ["convective", "mcs"]}
3visualize_options = default.runtime(**kwargs)
4visualize_options.to_yaml(options_directory / "visualize.yml")
5visualize_options = None
We can now perform our tracking run; note the run will be slow as we are
generating runtime figures for both convective and MCS objects, and not
using parallelization. To make the run go much faster, set
visualize_options = None and use the the parallel tracking function.
1times = utils.generate_times(data_options.dataset_by_name("cpol").filepaths)
2args = [times, data_options, grid_options, track_options]
3parallel.track(*args, output_directory=output_parent, dataset_name="cpol", debug_mode=False)
4# track.track(*args, visualize_options=visualize_options, output_directory=output_parent)
2025-07-09 16:39:42,598 - thuner.parallel - INFO - Beginning parallel tracking with 4 processes.
2025-07-09 16:39:58,766 - thuner.track.track - INFO - Beginning thuner tracking. Saving output to /home/ewan/THUNER_output/runs/cpol/geographic/interval_3.
2025-07-09 16:39:58,771 - thuner.track.track - INFO - Beginning thuner tracking. Saving output to /home/ewan/THUNER_output/runs/cpol/geographic/interval_0.
2025-07-09 16:39:58,773 - thuner.track.track - INFO - Beginning thuner tracking. Saving output to /home/ewan/THUNER_output/runs/cpol/geographic/interval_1.
2025-07-09 16:39:58,790 - thuner.track.track - INFO - Beginning thuner tracking. Saving output to /home/ewan/THUNER_output/runs/cpol/geographic/interval_2.
2025-07-09 16:40:00,510 - thuner.track.track - INFO - Processing 2005-11-13T14:00:09.
2025-07-09 16:40:00,512 - thuner.utils - INFO - Updating cpol input record for 2005-11-13T14:00:09.
2025-07-09 16:40:00,518 - thuner.data.aura - INFO - Updating cpol dataset for 2005-11-13T14:00:09.
2025-07-09 16:40:00,569 - thuner.track.track - INFO - Processing 2005-11-13T15:10:23.
2025-07-09 16:40:00,575 - thuner.utils - INFO - Updating cpol input record for 2005-11-13T15:10:23.
2025-07-09 16:40:00,587 - thuner.data.aura - INFO - Updating cpol dataset for 2005-11-13T15:10:23.
2025-07-09 16:40:00,675 - thuner.data.aura - INFO - Creating new geographic grid with spacing 0.025 m, 0.025 m.
2025-07-09 16:40:00,722 - thuner.data._utils - INFO - Building regridder; this can take a while for large grids.
2025-07-09 16:40:00,767 - thuner.data.aura - INFO - Creating new geographic grid with spacing 0.025 m, 0.025 m.
2025-07-09 16:40:00,769 - thuner.track.track - INFO - Processing 2005-11-13T17:30:09.
...
Once completed, outputs are available in the output_parent
directory. The visualization folder will contain figures like that
below, which illustrate the matching process. Currently THUNER supports
the TINT/MINT matching approach, but the goal is to eventually
incorporate others. Note that if viewing online, the figures below can
be viewed at original scale by right clicking, save image as, and
opening locally, or by right clicking, open in new tab, etc.
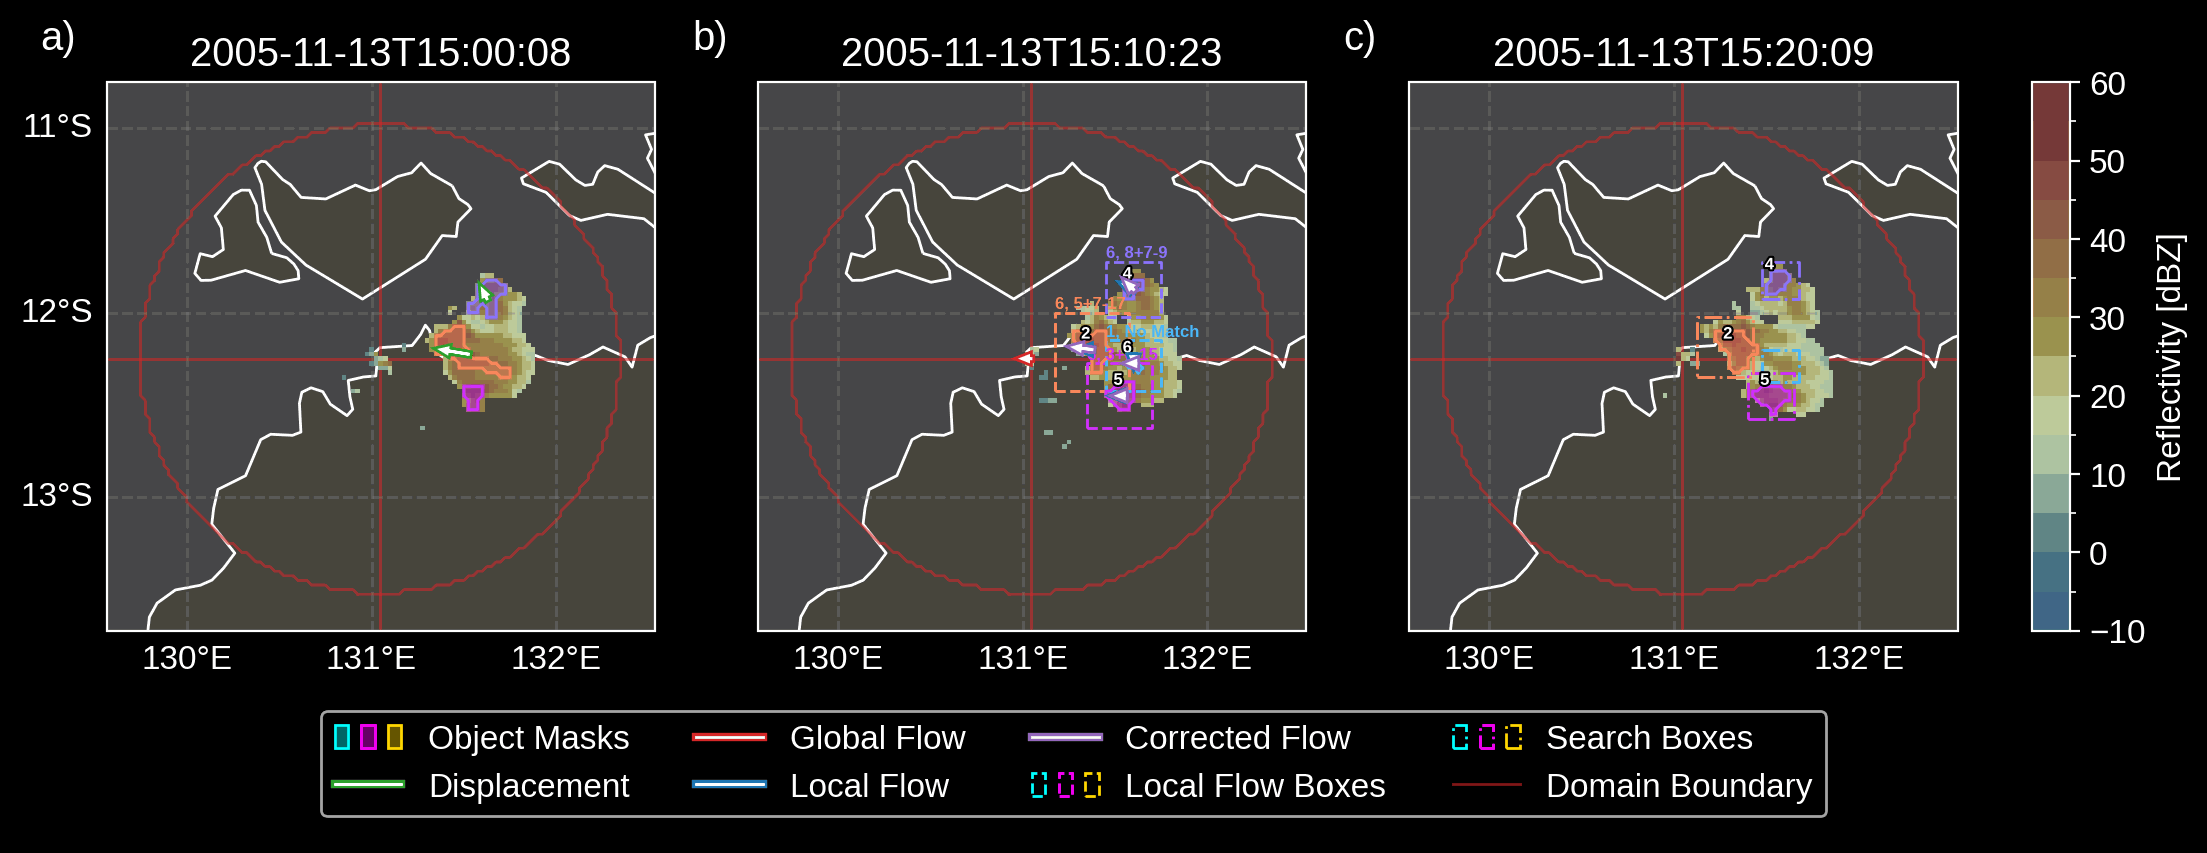
Fig. 3.2 Visualization of the TINT/MINT matching process.
Definitions of terms appearing in the above figure are provided by Raut et al. (2021). Note the displacement vector for the central orange object is large due to the object changing shape suddenly. Similar jumps occur when objects split and merge, and for this reason, object center displacements are ill suited to define object velocities. Instead, object velocities are calculated by smoothing the corrected local flow vectors, as discussed by Short et al. (2023). Animations of all the runtime matching figures for the convective objects are provided below.

Fig. 3.3 Convective object matching.
We also provide the matching figures for the MCS objects. Note there is only one MCS object, which is comprised of multiple disjoint convective objects; the grouping method is described by Short et al. (2023).
Fig. 3.4 MCS object matching.
Recall that when setting up the options above, we instructed THUNER to keep a record of the IDs of each member object (convective, middle and stratiform echoes) comprising each grouped mcs object. Note that only the mcs and convective objects are matched between times.
1filepath = output_parent / "attributes/mcs/group.csv"
2columns = ["convective_ids", "middle_ids", "anvil_ids"]
3print(attribute.utils.read_attribute_csv(filepath, columns=columns).to_string())
                                 convective_ids     middle_ids anvil_ids
time                universal_id
2005-11-13 14:10:23 1                       1 2              1       1 2
2005-11-13 14:20:09 1                         2              1         1
2005-11-13 14:30:09 1                         2              1         1
2005-11-13 14:40:09 1                       2 4              1       1 2
2005-11-13 14:50:09 1                       2 4              1         1
2005-11-13 15:00:08 1                     2 4 5              1         1
2005-11-13 15:10:23 1                   2 4 5 6          1 2 3         1
2005-11-13 15:20:09 1                     5 2 4            1 2         1
2005-11-13 15:30:09 1                     5 2 4        1 2 3 4         1
2005-11-13 15:40:09 1                     5 2 4        1 2 3 4     1 2 3
2005-11-13 15:50:09 1                     5 2 4      1 2 3 4 6       1 2
2005-11-13 16:00:08 1                     5 2 4            1 3         1
2005-11-13 16:10:23 1                   5 2 4 7        1 2 3 4         1
...
We can also perform analysis on, and visualization of, the MCS objects.
1analysis_options = analyze.mcs.AnalysisOptions()
2analysis_options.to_yaml(options_directory / "analysis.yml")
3analyze.mcs.process_velocities(output_parent)
4analyze.mcs.quality_control(output_parent, analysis_options)
5analyze.mcs.classify_all(output_parent, analysis_options)
2025-07-09 16:43:37,032 - thuner.option.grid - WARNING - shape not specified. Will attempt to infer from input.
2025-07-09 16:43:37,373 - thuner.option.grid - WARNING - shape not specified. Will attempt to infer from input.
1style = "presentation"
2attribute_handlers = default.grouped_attribute_handlers(output_parent, style)
3kwargs = {"name": "mcs_attributes", "object_name": "mcs", "style": style}
4kwargs.update({"attribute_handlers": attribute_handlers})
5figure_options = option.visualize.GroupedHorizontalAttributeOptions(**kwargs)
6args = [output_parent, start, end, figure_options, "cpol"]
7args_dict = {"parallel_figure": True, "by_date": False, "num_processes": 4}
8visualize.attribute.series(*args, **args_dict)
2025-07-09 16:43:41,548 - thuner.option.grid - WARNING - shape not specified. Will attempt to infer from input.
2025-07-09 16:43:41,708 - thuner.visualize.attribute - INFO - Visualizing attributes at time 2005-11-13T14:00:09.000000000.
2025-07-09 16:43:41,785 - thuner.data.aura - INFO - Updating cpol dataset for 2005-11-13T14:00:09.
2025-07-09 16:43:41,825 - thuner.data.aura - INFO - Creating new geographic grid with spacing 0.025 m, 0.025 m.
2025-07-09 16:43:41,839 - thuner.data._utils - INFO - Loading regridder from file.
2025-07-09 16:43:42,797 - thuner.utils - INFO - Grid options not set. Inferring from dataset.
2025-07-09 16:43:44,342 - thuner.visualize.attribute - INFO - Saving mcs_attributes figure for 2005-11-13T14:00:09.000000000.
2025-07-09 16:43:52,557 - thuner.visualize.attribute - INFO - Visualizing attributes at time 2005-11-13T14:20:09.000000000.
2025-07-09 16:43:52,562 - thuner.visualize.attribute - INFO - Visualizing attributes at time 2005-11-13T14:10:23.000000000.
2025-07-09 16:43:52,647 - thuner.data.aura - INFO - Updating cpol dataset for 2005-11-13T14:20:09.
2025-07-09 16:43:52,653 - thuner.data.aura - INFO - Updating cpol dataset for 2005-11-13T14:10:23.
2025-07-09 16:43:52,716 - thuner.visualize.attribute - INFO - Visualizing attributes at time 2005-11-13T14:30:09.000000000.
2025-07-09 16:43:52,838 - thuner.data.aura - INFO - Updating cpol dataset for 2005-11-13T14:30:09.
2025-07-09 16:43:53,360 - thuner.data._utils - INFO - Loading regridder from file.
2025-07-09 16:43:53,362 - thuner.data._utils - INFO - Loading regridder from file.
...
3.3.3. Pre-Converted Data
We can also perform THUNER tracking runs on general datasets, we just
need to ensure they are pre-converted into a format recognized by
THUNER, i.e. gridded data files readable by xarray.open_dataset(),
with variables named according to
CF-conventions. To illustrate, we will
use the converted CPOL files that were generated by the code in the
previous section. We first modify the options used for the geographic
coordinates above. Re-run the relevant cells above again if necessary.
If you get a pydantic error, restart the notebook.
 1output_parent = base_local / "runs/cpol/pre_converted"
 2options_directory = output_parent / "options"
 3options_directory.mkdir(parents=True, exist_ok=True)
 4
 5if output_parent.exists() & remove_existing_outputs:
 6    shutil.rmtree(output_parent)
 7
 8# Get the pre-converted filepaths
 9base_filepath = base_local / "input_data/converted/cpol/cpol_level_1b/v2020/gridded/"
10base_filepath = base_filepath / "grid_150km_2500m/2005/20051113"
11filepaths = glob.glob(str(base_filepath / "*.nc"))
12filepaths = sorted(filepaths)
13
14# Create the data options.
15kwargs = {"name": "cpol", "fields": ["reflectivity"], "filepaths": filepaths}
16cpol_options = utils.BaseDatasetOptions(**times_dict, **kwargs)
17datasets=[cpol_options, era5_pl_options, era5_sl_options]
18data_options = option.data.DataOptions(datasets=datasets)
19data_options.to_yaml(options_directory / "data.yml")
20
21# Save other options
22grid_options.to_yaml(options_directory / "grid.yml")
23track_options.to_yaml(options_directory / "track.yml")
24
25# Switch off the runtime figures
26visualize_options = None
1times = utils.generate_times(data_options.dataset_by_name("cpol").filepaths)
2args = [times, data_options, grid_options, track_options, visualize_options]
3kwargs = {"output_directory": output_parent, "dataset_name": "cpol"}
4parallel.track(*args, **kwargs, debug_mode=True)
2025-07-09 16:47:47,099 - thuner.parallel - INFO - Beginning parallel tracking with 4 processes.
2025-07-09 16:47:47,114 - thuner.utils - INFO - get_filepaths being called from base class BaseDatasetOptions. In this case get_filepaths just subsets the filepaths list provided by the user.
2025-07-09 16:47:47,651 - thuner.track.track - INFO - Beginning thuner tracking. Saving output to /home/ewan/THUNER_output/runs/cpol/pre_converted/interval_0.
2025-07-09 16:47:47,669 - thuner.track.track - INFO - Processing 2005-11-13T13:10:23.
2025-07-09 16:47:47,672 - thuner.utils - INFO - Updating cpol input record for 2005-11-13T13:10:23.
2025-07-09 16:47:47,686 - thuner.utils - INFO - Grid options not set. Inferring from dataset.
2025-07-09 16:47:47,689 - thuner.utils - INFO - Domain mask found in dataset. Getting boundary coordinates.
2025-07-09 16:47:47,697 - thuner.track.track - INFO - Processing hierarchy level 0.
2025-07-09 16:47:47,701 - thuner.track.track - INFO - Tracking convective.
2025-07-09 16:47:47,708 - thuner.detect.steiner - INFO - Compiling thuner.detect.steiner.steiner_scheme with Numba. Please wait.
2025-07-09 16:47:59,343 - thuner.match.match - INFO - Matching convective objects.
2025-07-09 16:47:59,344 - thuner.match.match - INFO - No current mask, or no objects in current mask.
2025-07-09 16:47:59,347 - thuner.track.track - INFO - Tracking middle.
2025-07-09 16:47:59,353 - thuner.track.track - INFO - Tracking anvil.
2025-07-09 16:47:59,358 - thuner.track.track - INFO - Processing hierarchy level 1.
...
1analysis_options = analyze.mcs.AnalysisOptions()
2analysis_options.to_yaml(options_directory / "analysis.yml")
3analyze.mcs.process_velocities(output_parent)
4analyze.mcs.quality_control(output_parent, analysis_options)
5analyze.mcs.classify_all(output_parent, analysis_options)
2025-07-09 16:48:45,446 - thuner.option.grid - WARNING - shape not specified. Will attempt to infer from input.
2025-07-09 16:48:45,769 - thuner.option.grid - WARNING - shape not specified. Will attempt to infer from input.
1style = "presentation"
2attribute_handlers = default.grouped_attribute_handlers(output_parent, style)
3kwargs = {"name": "mcs_attributes", "object_name": "mcs", "style": style}
4kwargs.update({"attribute_handlers": attribute_handlers})
5figure_options = option.visualize.GroupedHorizontalAttributeOptions(**kwargs)
6args = [output_parent, start, end, figure_options, "cpol"]
7args_dict = {"parallel_figure": True, "by_date": False, "num_processes": 4}
8visualize.attribute.series(*args, **args_dict)
2025-07-09 16:48:50,223 - thuner.option.grid - WARNING - shape not specified. Will attempt to infer from input.
2025-07-09 16:48:50,428 - thuner.visualize.attribute - INFO - Visualizing attributes at time 2005-11-13T14:00:09.000000000.
2025-07-09 16:48:50,527 - thuner.utils - INFO - Grid options not set. Inferring from dataset.
2025-07-09 16:48:50,529 - thuner.utils - INFO - Domain mask found in dataset. Getting boundary coordinates.
2025-07-09 16:48:51,199 - thuner.visualize.attribute - INFO - Saving mcs_attributes figure for 2005-11-13T14:00:09.000000000.
2025-07-09 16:49:00,789 - thuner.visualize.attribute - INFO - Visualizing attributes at time 2005-11-13T14:10:23.000000000.
2025-07-09 16:49:00,930 - thuner.visualize.attribute - INFO - Visualizing attributes at time 2005-11-13T14:20:09.000000000.
2025-07-09 16:49:01,103 - thuner.visualize.attribute - INFO - Visualizing attributes at time 2005-11-13T14:30:09.000000000.
2025-07-09 16:49:01,790 - thuner.utils - INFO - Domain mask found in dataset. Getting boundary coordinates.
2025-07-09 16:49:01,862 - thuner.utils - INFO - Domain mask found in dataset. Getting boundary coordinates.
2025-07-09 16:49:02,002 - thuner.utils - INFO - Domain mask found in dataset. Getting boundary coordinates.
2025-07-09 16:49:02,686 - thuner.visualize.attribute - INFO - Visualizing attributes at time 2005-11-13T14:40:09.000000000.
2025-07-09 16:49:02,967 - thuner.visualize.attribute - INFO - Saving mcs_attributes figure for 2005-11-13T14:20:09.000000000.
2025-07-09 16:49:03,010 - thuner.visualize.attribute - INFO - Saving mcs_attributes figure for 2005-11-13T14:10:23.000000000.
2025-07-09 16:49:03,404 - thuner.visualize.attribute - INFO - Saving mcs_attributes figure for 2005-11-13T14:30:09.000000000.
...
Note we can achieve the same result in this case by modifying
converted_options={"save": True} to
converted_options={"load": True} in the Geographic
Coordinates section,and rerunning the
cells.
3.3.4. Cartesian Coordinates
Because the CPOL radar domains are small (150 km radii), it is reasonable to perform tracking in Cartesian coordinates. This should make the run faster as we are no longer performing regridding on the fly. We will also switch off the runtime figure generation.
 1output_parent = base_local / "runs/cpol/cartesian"
 2options_directory = output_parent / "options"
 3options_directory.mkdir(parents=True, exist_ok=True)
 4
 5if output_parent.exists() & remove_existing_outputs:
 6    shutil.rmtree(output_parent)
 7
 8# Recreate the original cpol dataset options
 9cpol_options = data.aura.CPOLOptions(**times_dict)
10datasets = [cpol_options, era5_pl_options, era5_sl_options]
11data_options = option.data.DataOptions(datasets=datasets)
12data_options.to_yaml(options_directory / "data.yml")
13
14# Create the grid_options
15grid_options = option.grid.GridOptions(name="cartesian", regrid=False)
16grid_options.to_yaml(options_directory / "grid.yml")
17
18# Save the same track options from earlier
19track_options.to_yaml(options_directory / "track.yml")
20visualize_options = None
2025-07-09 16:54:15,071 - thuner.data.aura - INFO - Generating cpol filepaths.
2025-07-09 16:54:15,094 - thuner.option.grid - WARNING - altitude not specified. Using default altitudes.
2025-07-09 16:54:15,097 - thuner.option.grid - WARNING - shape not specified. Will attempt to infer from input.
1times = utils.generate_times(data_options.dataset_by_name("cpol").filepaths)
2args = [times, data_options, grid_options, track_options, visualize_options]
3kwargs = {"output_directory": output_parent, "dataset_name": "cpol"}
4# parallel.track(*args, **kwargs)
5track.track(*args, output_directory=output_parent)
2025-07-09 16:54:16,658 - thuner.track.track - INFO - Beginning thuner tracking. Saving output to /home/ewan/THUNER_output/runs/cpol/cartesian.
2025-07-09 16:54:16,741 - thuner.track.track - INFO - Processing 2005-11-13T14:00:09.
2025-07-09 16:54:16,742 - thuner.utils - INFO - Updating cpol input record for 2005-11-13T14:00:09.
2025-07-09 16:54:16,743 - thuner.data.aura - INFO - Updating cpol dataset for 2005-11-13T14:00:09.
2025-07-09 16:54:16,863 - thuner.utils - INFO - Grid options not set. Inferring from dataset.
2025-07-09 16:54:16,927 - thuner.track.track - INFO - Processing hierarchy level 0.
2025-07-09 16:54:16,928 - thuner.track.track - INFO - Tracking convective.
2025-07-09 16:54:16,946 - thuner.match.match - INFO - Matching convective objects.
2025-07-09 16:54:16,948 - thuner.match.match - INFO - No current mask, or no objects in current mask.
2025-07-09 16:54:16,951 - thuner.track.track - INFO - Tracking middle.
2025-07-09 16:54:16,958 - thuner.track.track - INFO - Tracking anvil.
2025-07-09 16:54:16,964 - thuner.track.track - INFO - Processing hierarchy level 1.
2025-07-09 16:54:16,965 - thuner.track.track - INFO - Tracking mcs.
2025-07-09 16:54:16,990 - thuner.match.match - INFO - Matching mcs objects.
2025-07-09 16:54:16,992 - thuner.match.match - INFO - No current mask, or no objects in current mask.
2025-07-09 16:54:17,053 - thuner.track.track - INFO - Processing 2005-11-13T14:10:23.
...
1analysis_options = analyze.mcs.AnalysisOptions()
2analysis_options.to_yaml(options_directory / "analysis.yml")
3analyze.mcs.process_velocities(output_parent)
4analyze.mcs.quality_control(output_parent, analysis_options)
5analyze.mcs.classify_all(output_parent, analysis_options)
2025-07-09 16:54:46,091 - thuner.option.grid - WARNING - shape not specified. Will attempt to infer from input.
2025-07-09 16:54:46,344 - thuner.option.grid - WARNING - shape not specified. Will attempt to infer from input.
1style = "presentation"
2attribute_handlers = default.grouped_attribute_handlers(output_parent, style)
3kwargs = {"name": "mcs_attributes", "object_name": "mcs", "style": style}
4kwargs.update({"attribute_handlers": attribute_handlers})
5figure_options = option.visualize.GroupedHorizontalAttributeOptions(**kwargs)
6args = [output_parent, start, end, figure_options, "cpol"]
7args_dict = {"parallel_figure": False, "by_date": False, "num_processes": 1}
8visualize.attribute.series(*args, **args_dict)
2025-07-09 16:54:46,829 - thuner.option.grid - WARNING - shape not specified. Will attempt to infer from input.
2025-07-09 16:54:46,987 - thuner.visualize.attribute - INFO - Visualizing attributes at time 2005-11-13T14:00:09.000000000.
2025-07-09 16:54:47,060 - thuner.data.aura - INFO - Updating cpol dataset for 2005-11-13T14:00:09.
2025-07-09 16:54:47,124 - thuner.utils - INFO - Grid options not set. Inferring from dataset.
2025-07-09 16:54:47,871 - thuner.visualize.attribute - INFO - Saving mcs_attributes figure for 2005-11-13T14:00:09.000000000.
2025-07-09 16:54:48,743 - thuner.visualize.attribute - INFO - Visualizing attributes at time 2005-11-13T14:10:23.000000000.
2025-07-09 16:54:48,825 - thuner.data.aura - INFO - Updating cpol dataset for 2005-11-13T14:10:23.
2025-07-09 16:54:49,419 - thuner.visualize.attribute - INFO - Saving mcs_attributes figure for 2005-11-13T14:10:23.000000000.
2025-07-09 16:54:50,288 - thuner.visualize.attribute - INFO - Visualizing attributes at time 2005-11-13T14:20:09.000000000.
2025-07-09 16:54:50,369 - thuner.data.aura - INFO - Updating cpol dataset for 2005-11-13T14:20:09.
2025-07-09 16:54:50,973 - thuner.visualize.attribute - INFO - Saving mcs_attributes figure for 2005-11-13T14:20:09.000000000.
2025-07-09 16:54:51,852 - thuner.visualize.attribute - INFO - Visualizing attributes at time 2005-11-13T14:30:09.000000000.
2025-07-09 16:54:51,930 - thuner.data.aura - INFO - Updating cpol dataset for 2005-11-13T14:30:09.
2025-07-09 16:54:52,488 - thuner.visualize.attribute - INFO - Saving mcs_attributes figure for 2005-11-13T14:30:09.000000000.
2025-07-09 16:54:53,375 - thuner.visualize.attribute - INFO - Visualizing attributes at time 2005-11-13T14:40:09.000000000.
...